
What is the yield curve and why should you care? Yields on treasuries come from the bond market. The difference between debt instruments is what creates a yield spread. The yield spread is what creates the yield curve. If you are an investor or just want to have a better understanding of the economy, here is why you should follow the yield curve:
Following the bond market can help an investor predict the direction of the economy. There are four types of yield curves normal, steep, flat, and inverted. A normal yield curve shows growth. Ideally this is what you want. A steep yield curve shows growth but signals inflation is on the horizon. A flat yield curve indicates uncertainty. An inverted yield curve signals danger. When the yield curve is inverted this means that short-term bonds are higher than longer-term bonds. An inverted yield curve is strongly suggestive of an economic slowdown leading toward recession. Furthermore, while the yield curve is not an exact predictor, it has inverted prior to each of the last 10 recessions, which represents a strong track record (Segal, 2022).
Below I have presented three figures displaying the current yield curve from different perspectives. In Figure 1, the standard measurement of the yield curve is presented, which is the 10-year treasury minus the 2-year treasury. The black line on the chart represents zero percent. The blue line is the yield curve. As can be seen, the yield curve turned negative in July of 2022 and has only traveled deeper into negative territory since. The yield curve has been negative for 9-months now. Historically, that is long time for the yield curve to be negative. What this is telling us is that the current yield curve is negative by approximately 40% or 40 basis points. In March, it was negative 1.0% or 100 basis points, which is a steeply negative curve.
Figure 1
10-Year Treasury Constant Maturity Minus 2-Year Constant Maturity

Note. Adapted from Federal Reserve Bank of St. Louis. Retrieved from https://fred.stlouisfed.org/series/T10Y2Y
In Figure 2, another measure of the yield curve is used, which is the 10-Year treasury minus the 3-Month treasury. Some economists believe this is a more accurate view of the yield curve, so that is why I included it in this discussion. What is critical to point out here is that this measurement not only displays an inverted yield curve, but it is historically the deepest inversion ever recorded using this measurement going back about 40 years.
Figure 2
10-Year Treasury Constant Maturity Minus 3-Month Treasury Constant Maturity
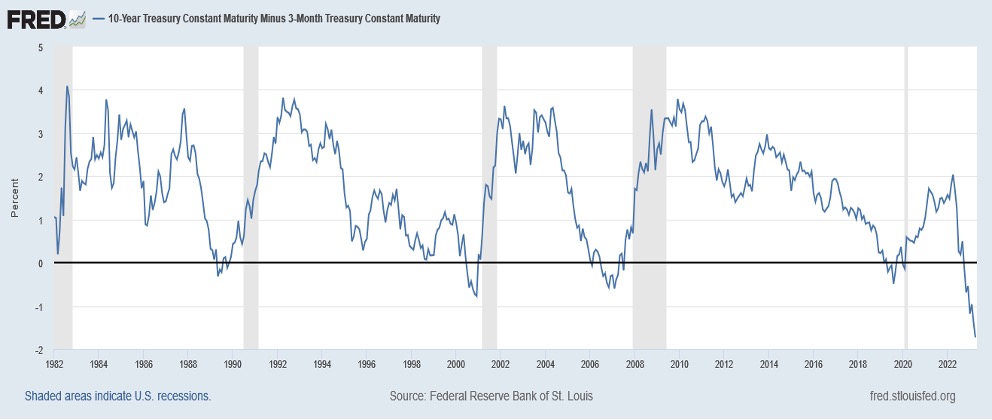
Note. Adapted from Federal Reserve Bank of St. Louis. Retrieved from https://fred.stlouisfed.org/series/T10Y3M
In Figure 3, the yield curve is displayed using the 10-Year treasury minus the Federal Funds Rate. Again, we can see with this measurement that the yield curve is clearly inverted. Using this calculation, the yield curve inverted in November 2022. The Federal Funds Rate as of April 2023 is 4.75%-5.00%. The 10-Year Treasury is approximately 3.44%.
Figure 3
10-Year Treasury Constant Maturity Minus Federal Funds Rate
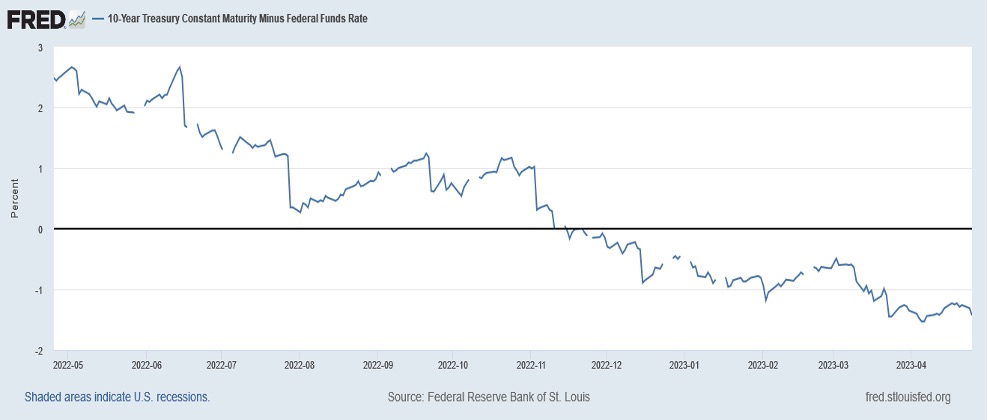
Note. Adapted from Federal Reserve Bank of St. Louis. Retrieved from https://fred.stlouisfed.org/series/T10YFF
Bottom line, what does this mean? The inverted yield curve is historically a very bad sign. While not a 100% predictor, it has been an accurate measurement for a long time. This is signaling that a recession is coming. What is troubling here is the length of time the curve has been inverted and the steepness of that inversion. This would tend to indicate that the coming recession is going to be a severe one. Ultimately, the bond market is saying they do not see any growth on the horizon. The bond market sees a retraction coming and a big one. That can mean, a reduction in corporate earnings and profits, layoffs, persistent inflation, and drops in stock market and real estate values. We must continue to keep a very close on the yield curve in the months ahead.
Sources: Segal, T. (2022, June 29). The Predictive Powers of the Bond Yield Curve. Investopedia. Retrieved from https://www.investopedia.com/articles/economics/08/yield-curve.asp?hid=c7f65df4ea9fd56a5c2c8e05c09cc2f3457e4861&did=8543959-20230312
Leave a Reply